Turn everyday phone use into a clearer record: notice the rhythms behind your time, compare the habits that shape it, and decide what you want to change.
Awareness over avoidance
A rule is easy to work around. Awareness is harder to ignore.
Blocking apps can be useful in a particular moment, but it does not always fit a phone you need for messages, maps, work, or everyday life. A block can be bypassed; it also cannot show you what drew you in.
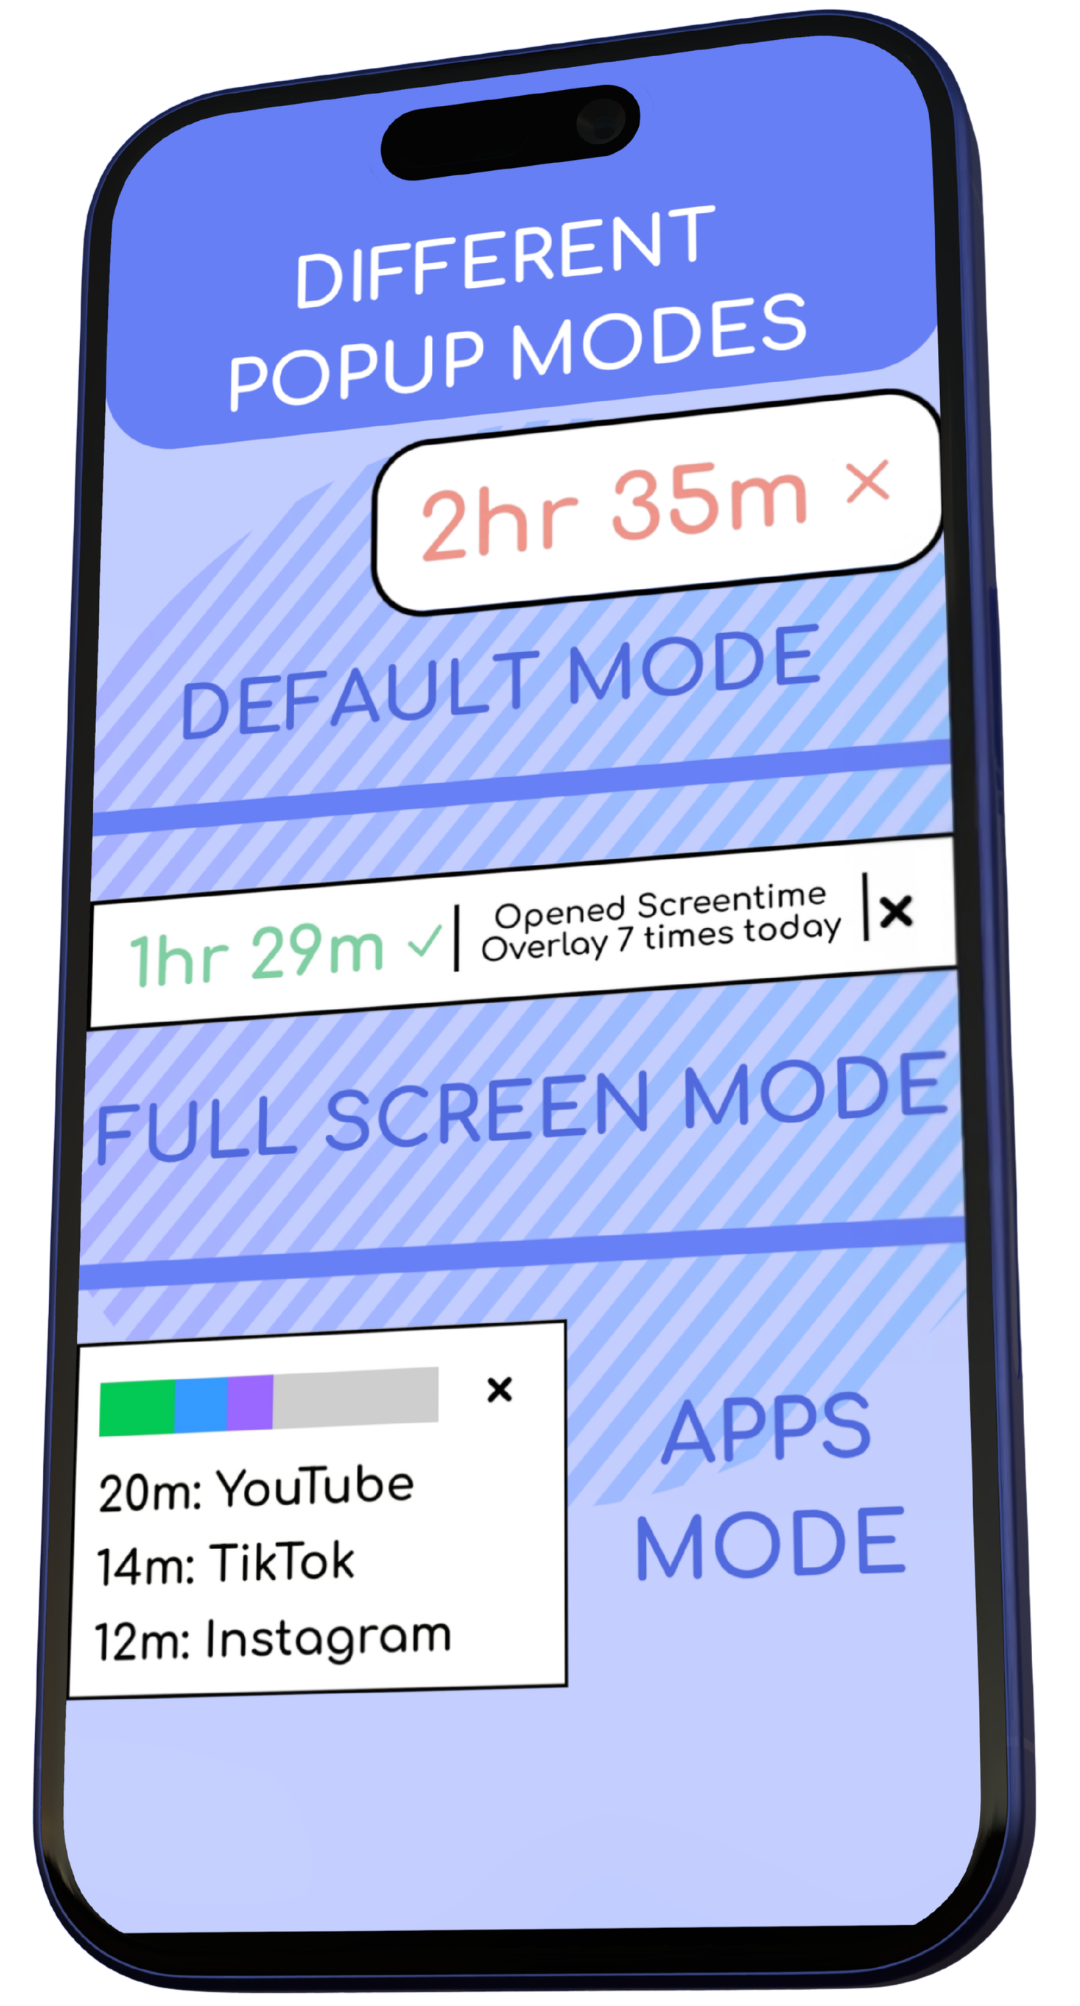
ScreenTime Overlay keeps the passing minutes visible while you scroll. That small interruption can turn an automatic session into a deliberate choice—whether that is five minutes on TikTok or another long stretch you did not mean to start.
It is a self-awareness tool, not a clinical treatment or a guarantee. For many people, though, seeing use as it happens is a more practical first step toward more intentional phone habits.
Beyond the total
The question is not only how long.
When you use your phone, how often you pick it up, and which apps draw you back can tell a more useful story than a single daily number. The charts below make those details easier to see.
Usage insights
More ways to read your habits.
Explore your weekly patterns, the apps behind them, and the settings that make the total meaningful to you.
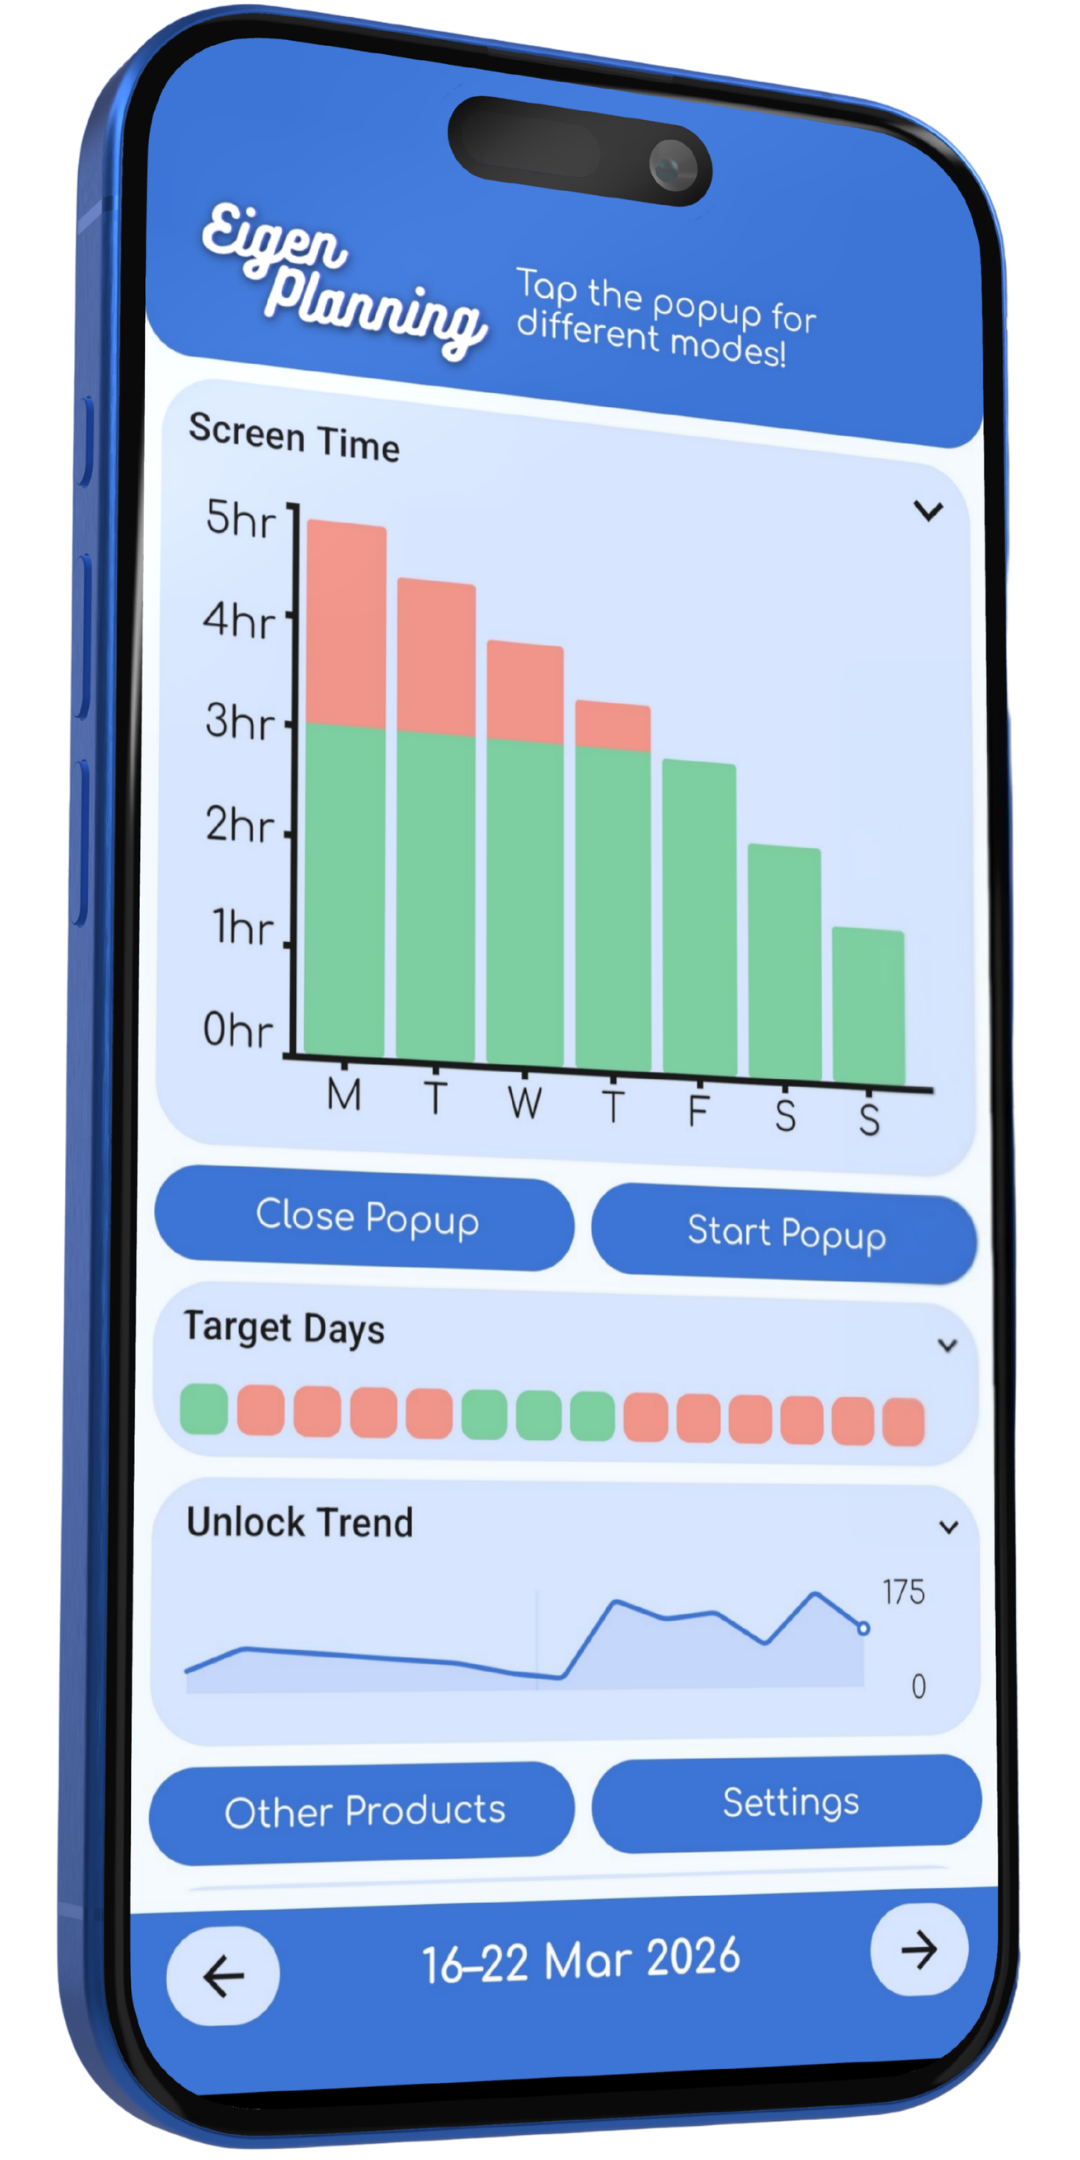
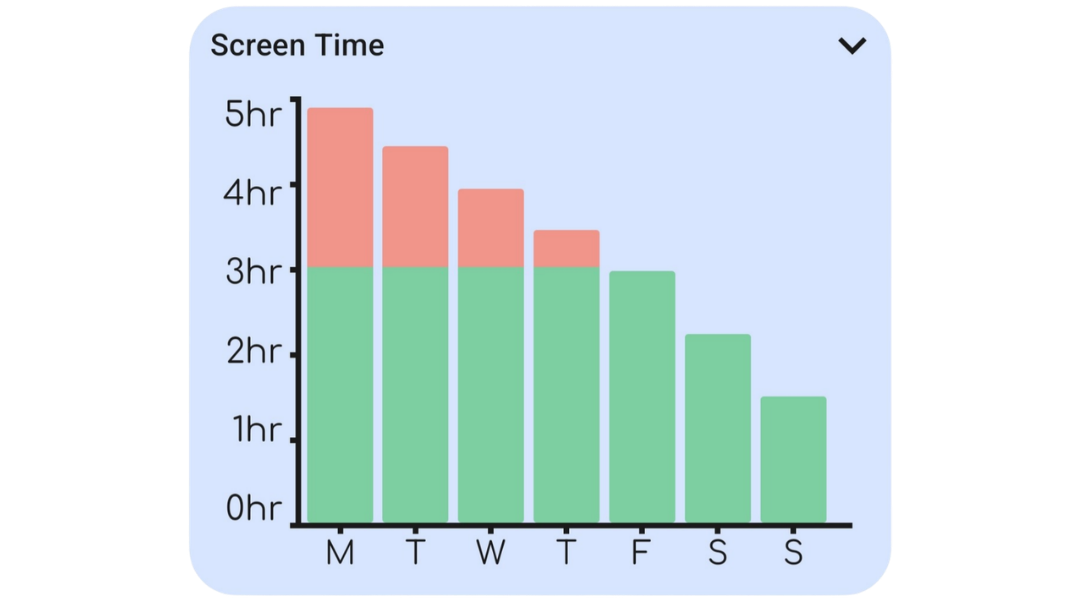
Usage against your daily target
Daily usage from your selected apps is shown as a bar: green while it is under your target and red once it exceeds it. The week selector controls the view, and the total is designed to match Android Digital Wellbeing.
It gives a quick, comparable check on whether your target is realistic and how consistently you meet it.
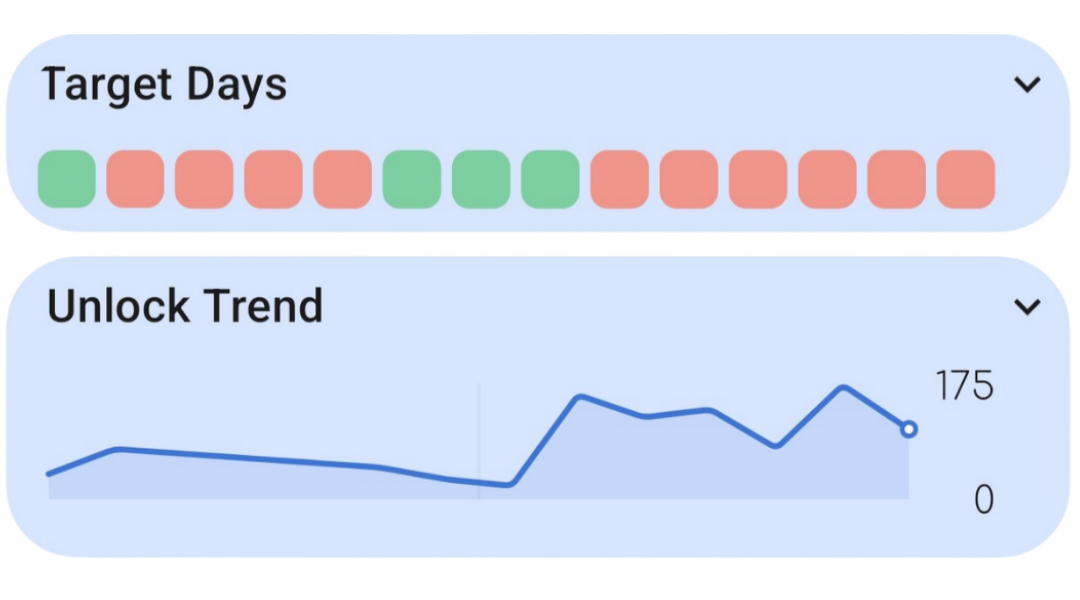
Target days and unlock trend
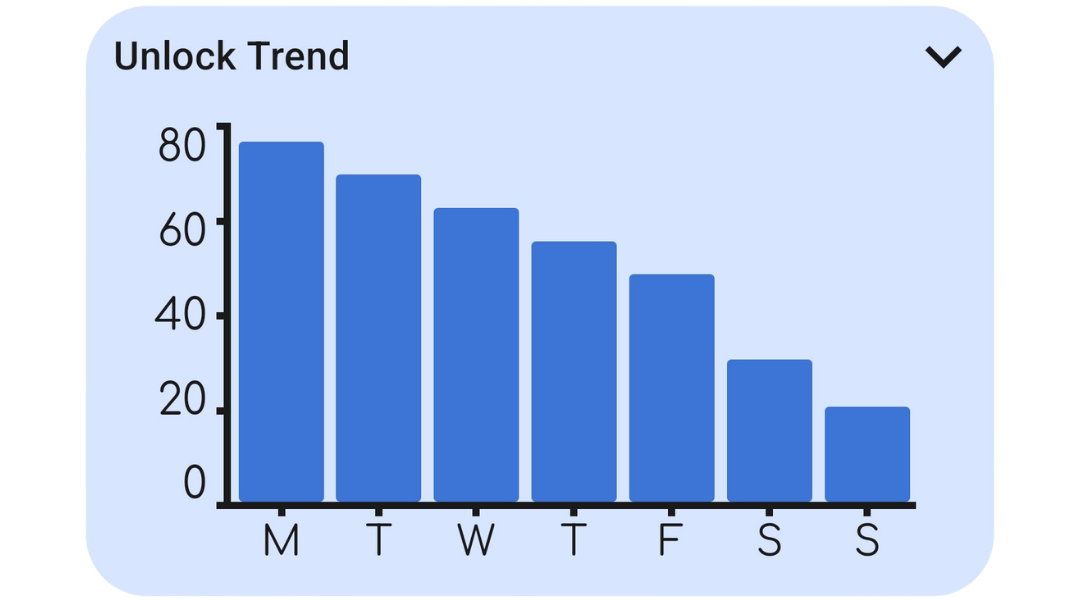
One chart records successful target days across a fixed two-week lookback, while the other tracks phone unlocks as a line graph.
Seeing both together helps distinguish reduced time on the phone from simply picking it up less often.
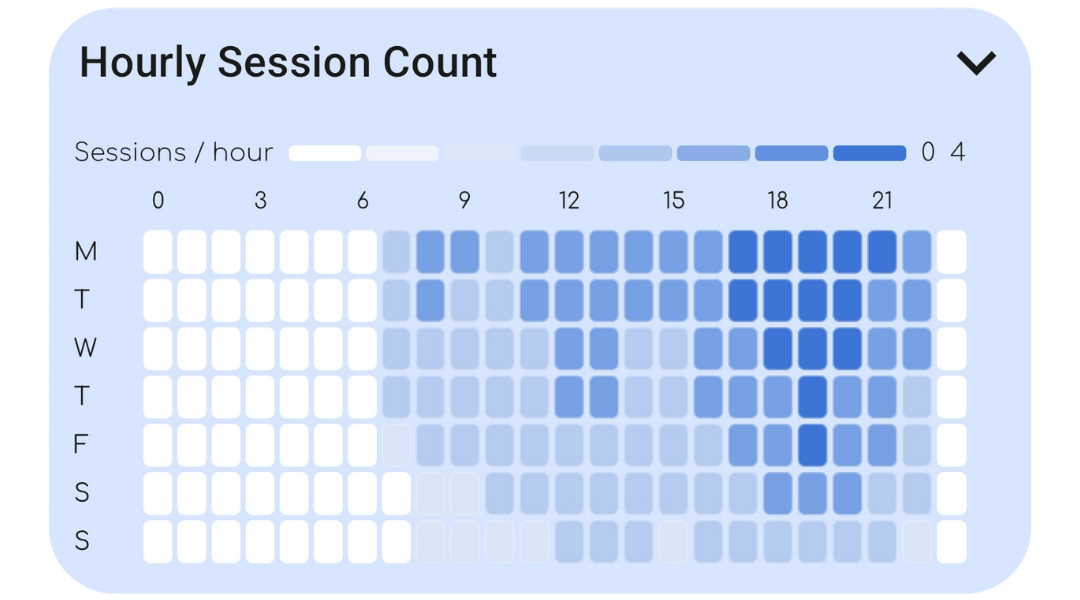
Hourly session heatmap
This heatmap maps session counts across every hour of the day and all seven days in the selected week.
It makes habitual check-in windows easy to spot, including patterns that a daily total would hide.
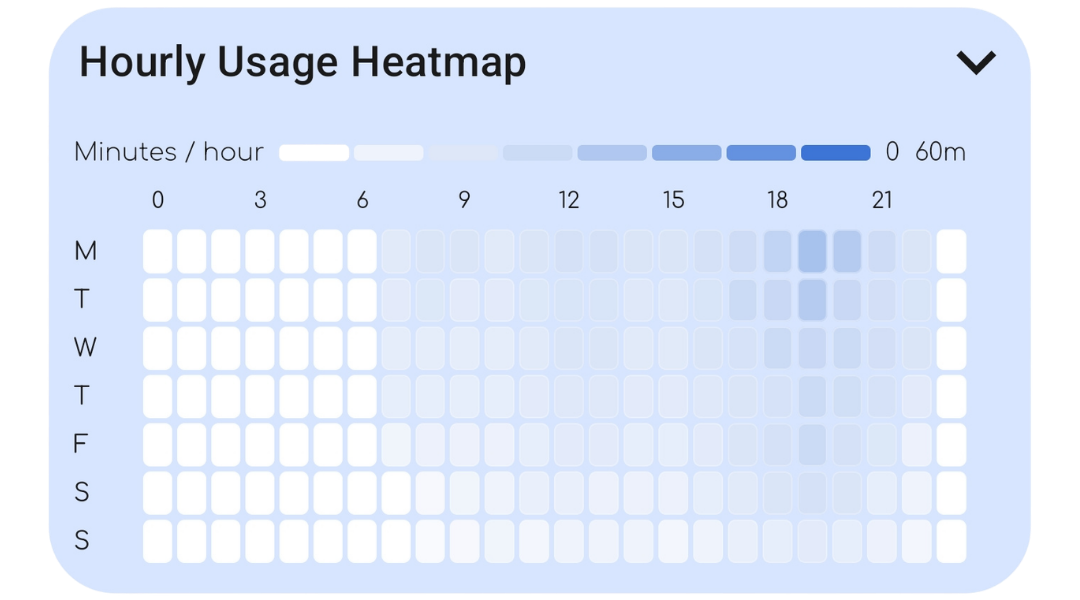
Hourly usage heatmap
Usage time is mapped by hour and day for whichever week the navigation controls are set to.
It shows when your longest stretches of phone use occur, so you can identify the times worth changing.
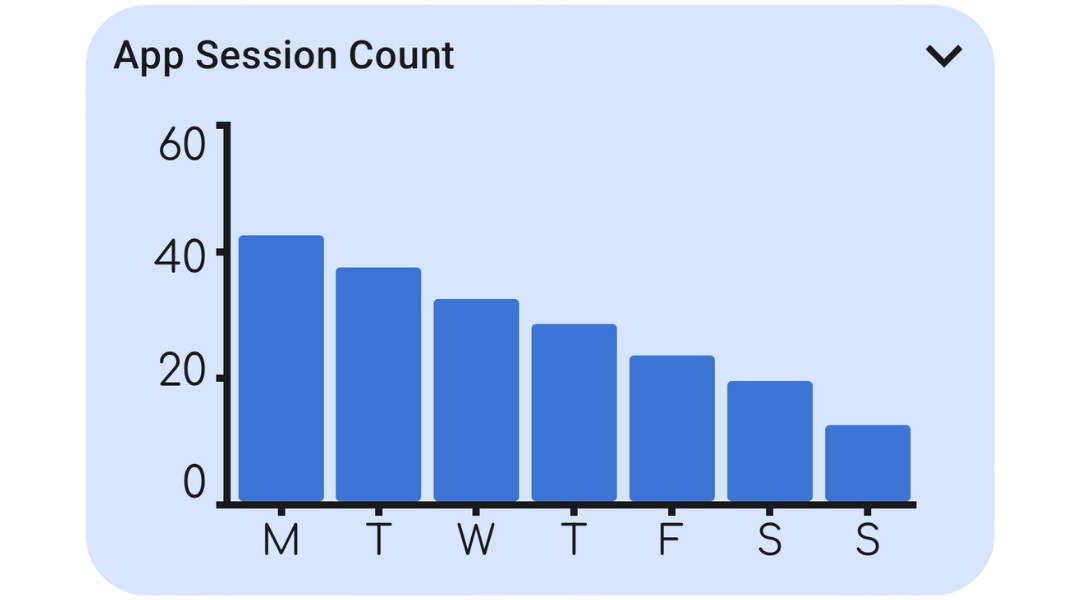
Total sessions by week
A weekly bar chart totals all sessions for the week chosen in the navigation.
This is useful when the frequency of reaching for the phone matters more than the total minutes.
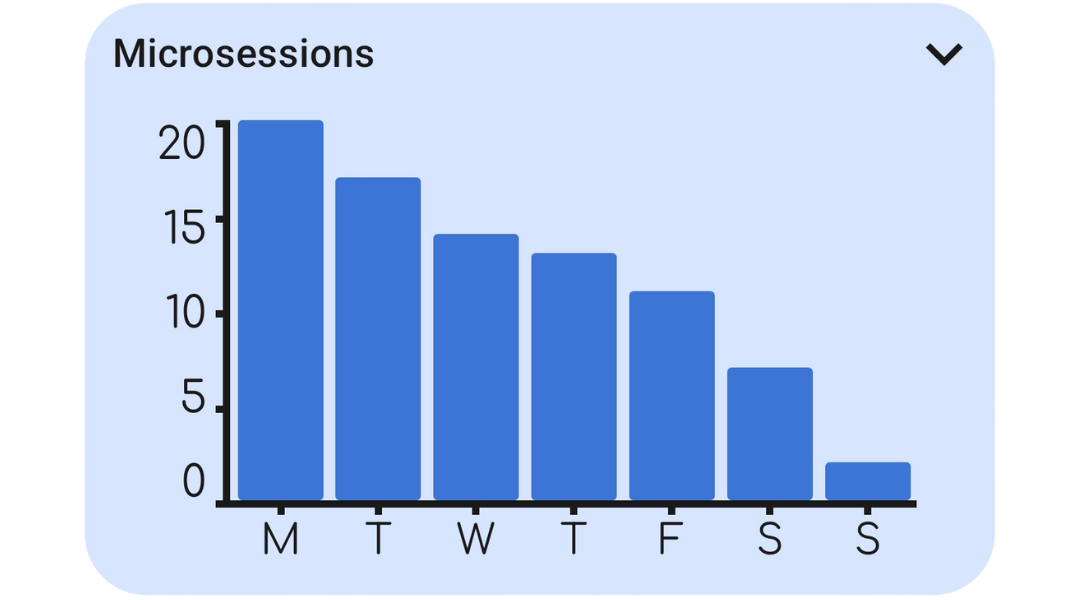
Microsessions by week
This chart totals microsessions—app openings that last less than a minute—for the selected week.
It highlights fragmented, reflexive use that can be almost invisible in an overall screen-time total.
Phone unlocks by week
Phone unlocks are shown as a weekly bar chart, controlled by the same week navigation.
Unlocks provide a simple measure of pickup behaviour, even before an app is opened.
Top apps by total usage
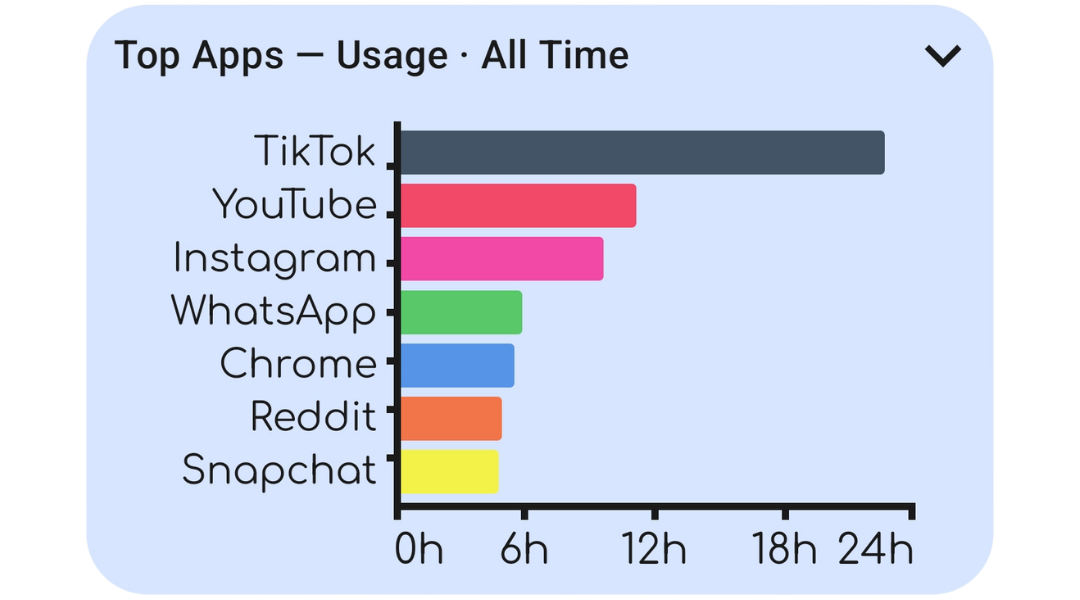
The top seven apps are ranked by total usage for the past week, month, year, or all time.
It reveals which apps account for the largest share of your attention over the period you care about.
Top apps by sessions
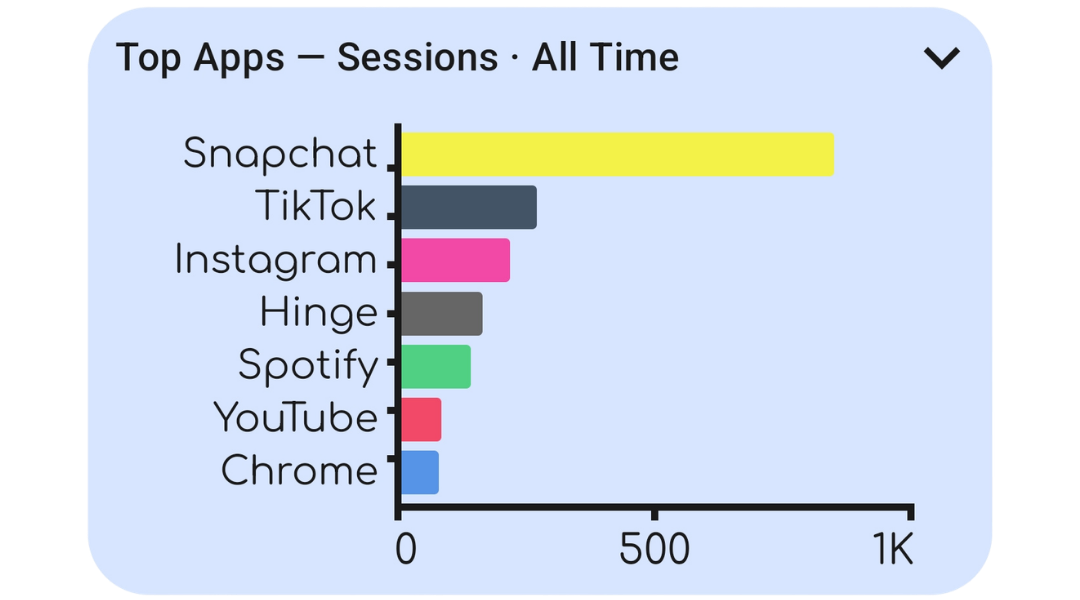
The top seven apps are ranked by how many sessions they receive, with week, month, year, and all-time ranges available.
It identifies apps you revisit most, including ones that do not consume much time per visit.
Top apps by average session length
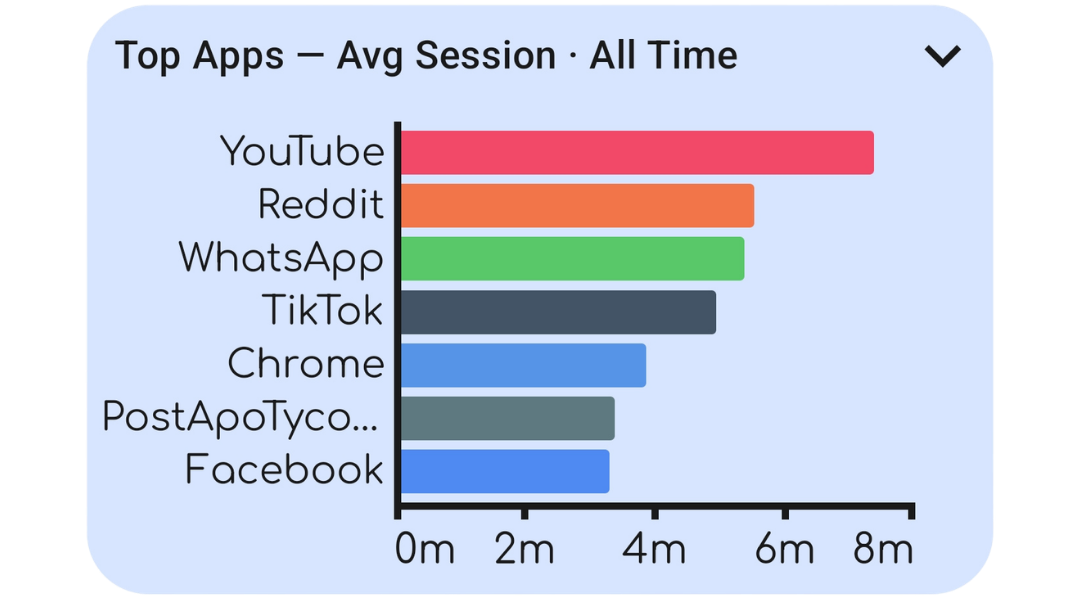
This ranks the top seven apps by average session length across the selected time range.
It separates deliberate, longer sessions from apps that are opened briefly but often.
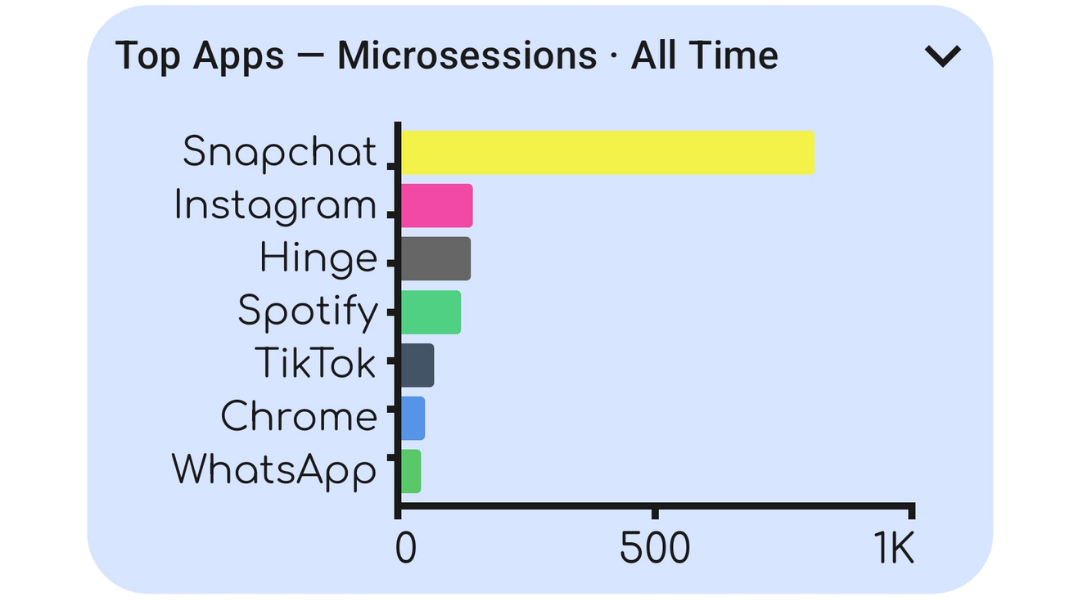
Top apps by microsessions
The top seven apps are ranked by short, under-one-minute openings for the chosen range.
It helps pinpoint the apps most associated with quick, automatic checking.
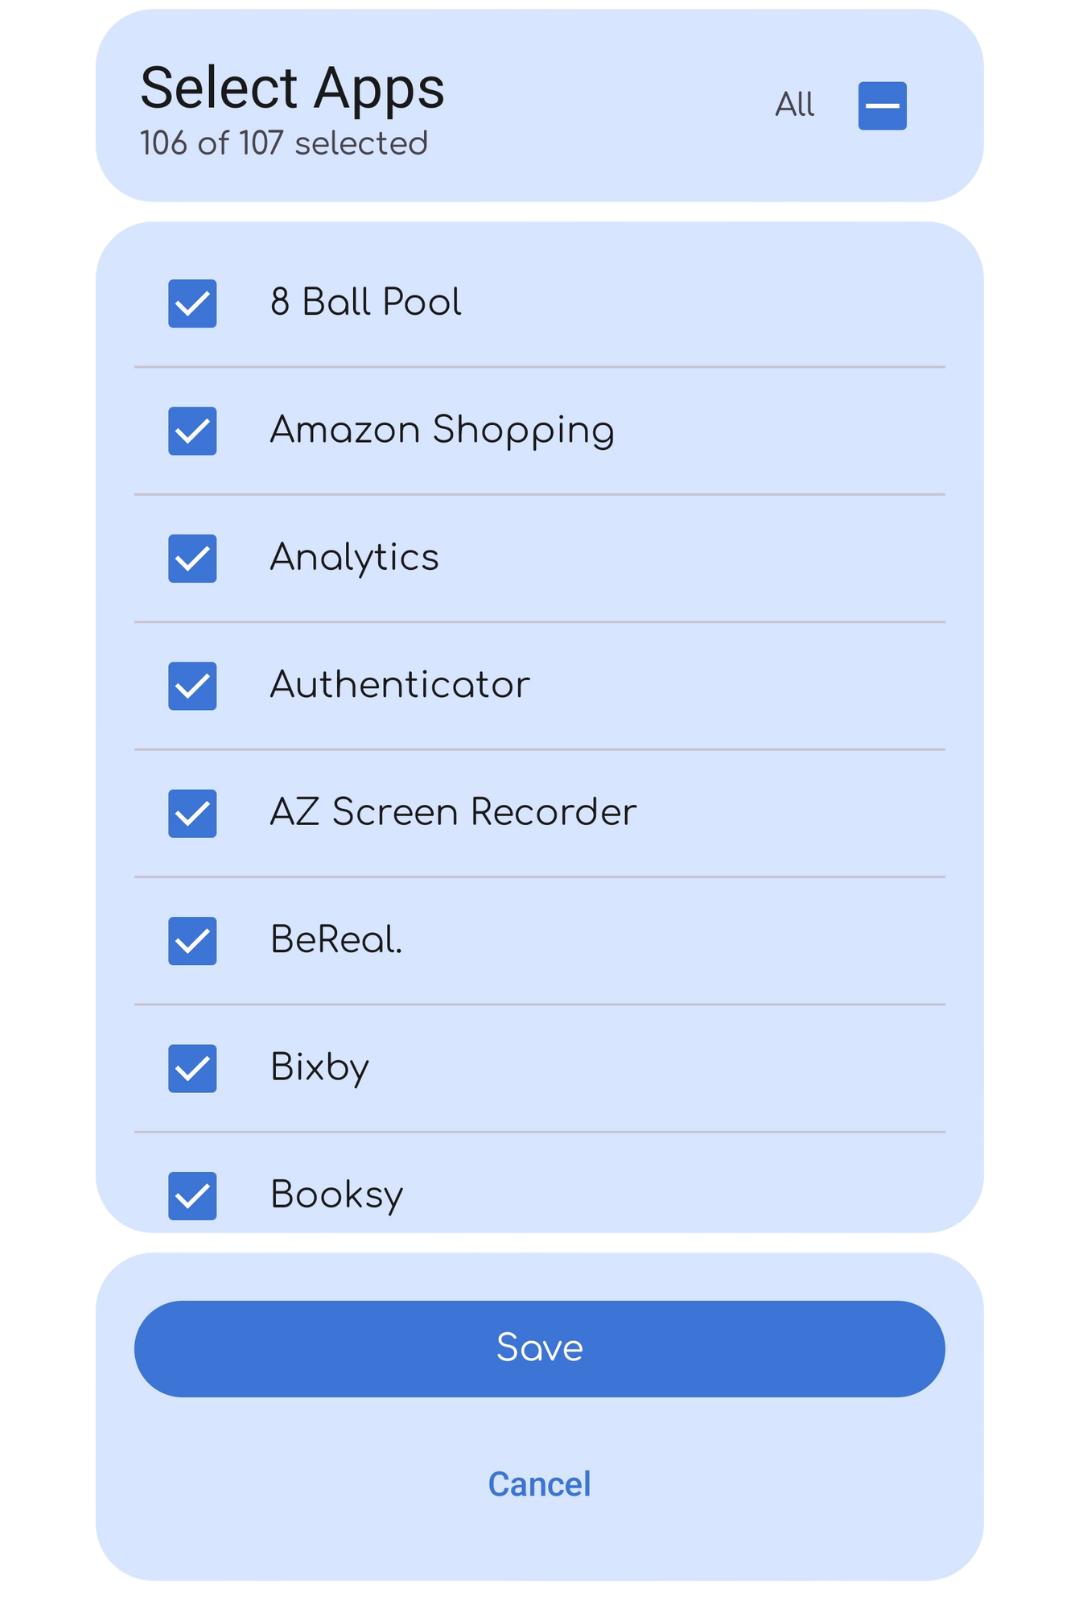
Choose the apps that count
Enable only the apps you want included in the total. Changes also recalculate recorded values from the previous seven days; older values remain fixed.
That lets your totals reflect your own definition of screen time without rewriting long-term history.
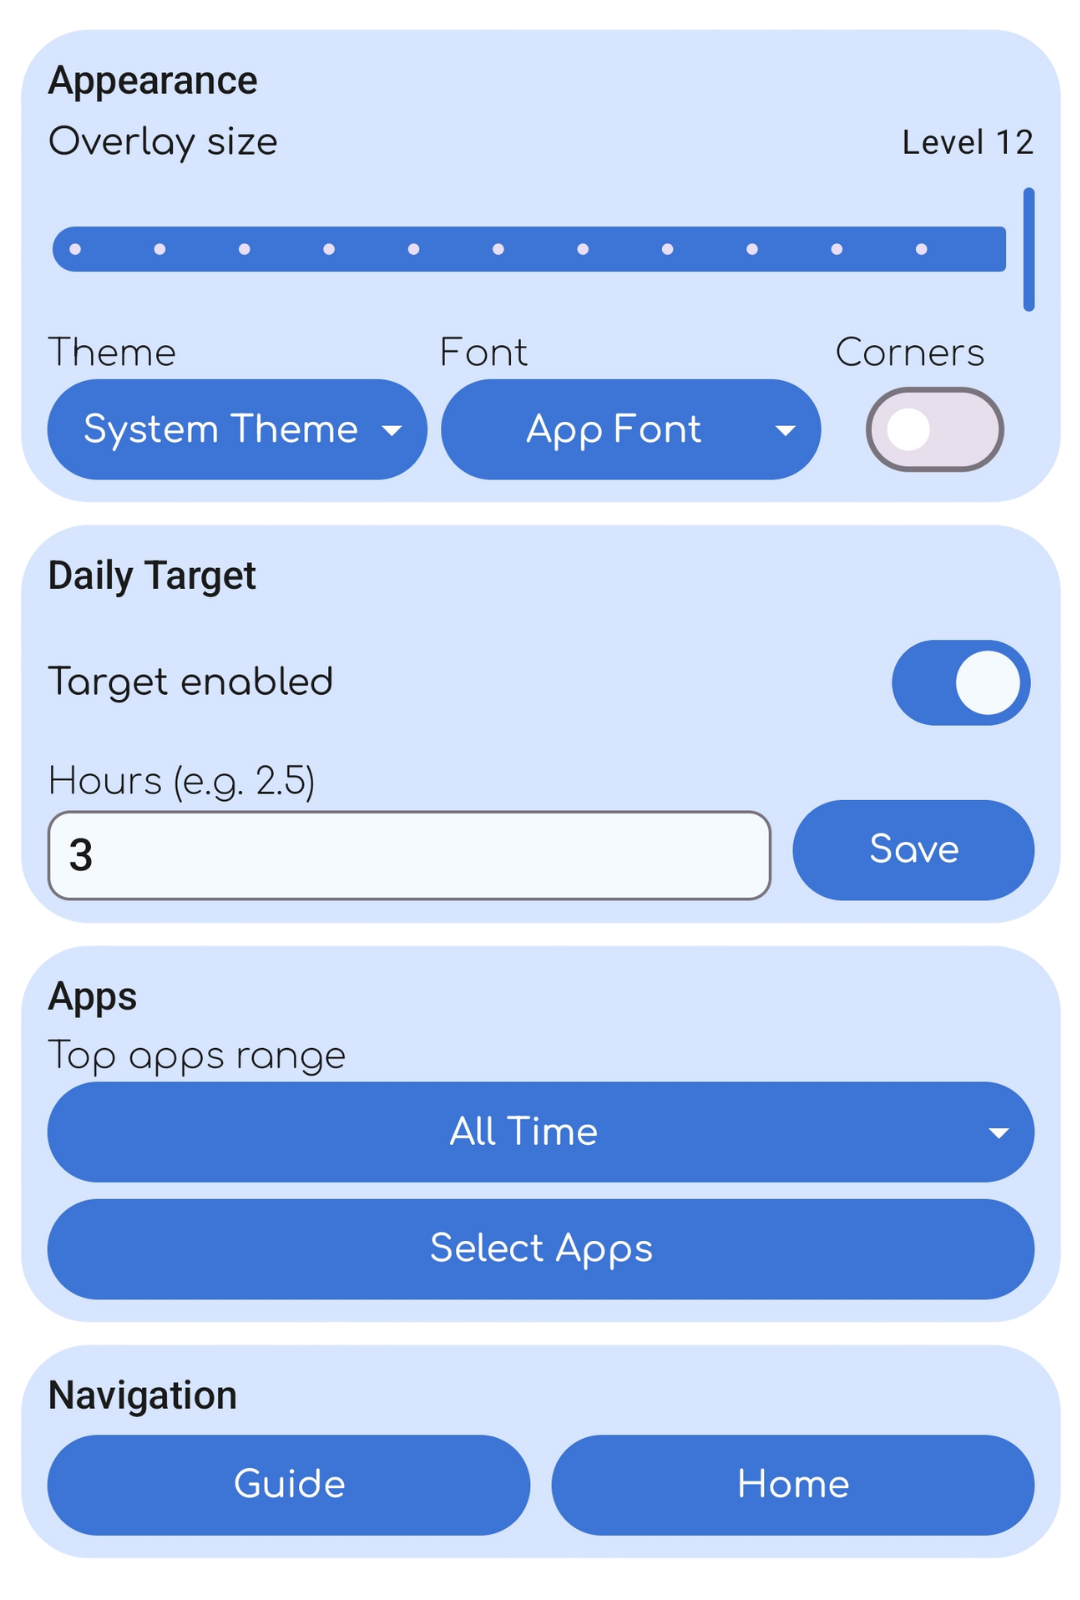
Tune the overlay to your phone
Choose a system or app-based font and light or dark theme, show a target on the popup, set the target time, and adjust popup size and corner rounding.
A readable, unobtrusive overlay is more likely to stay useful throughout the day.
Questions
Frequently asked questions
What information does ScreenTime Overlay use?
It uses Android usage access to retrieve app-usage time, calculate total daily screen time, and display the popup overlay. According to its privacy policy, this data stays on the device and is not transmitted off it.
Can I exclude apps from the total?
Yes. The app lets you choose which apps count towards the time total, so deselected apps do not count.
Does the app have a target?
Yes. You can set a daily target and enable a visual indicator for whether you are under or over it.
ScreenTime Overlay
Keep an eye on daily usage.
ScreenTime Overlay is available on Google Play. For help using the app, contact Eigen Planning by email.